Powered by Solar and Wind Energy
AERREVA
The following table demonstrates solar energy production examples using SunPower’s® Maxeon® Solar Cells with a 22.2% efficiency rating. The monthly range is derived solely from solar energy which is calculated by the average daily solar energy production multiplied by the efficiency and size of the solar panels. Various angles of the sun throughout the day are included. For information on solar power potential, the National Renewable Energy Laboratory for the U.S. Department of Energy provides information and solar maps for the U.S. on its website. Vehicle energy consumption is estimated (conservative) at 7.457 kWh (10 hp) at 55 mph.
Solar Energy Production
| AERREVA Model TPH |
|||||||
| Solar Panel Location |
Solar Panel Size | 5 kWh1 Potential |
Solar Panel Efficiency |
Daily kWh2 Production |
30 Day Total Production |
Driving Time3 | Monthly Range |
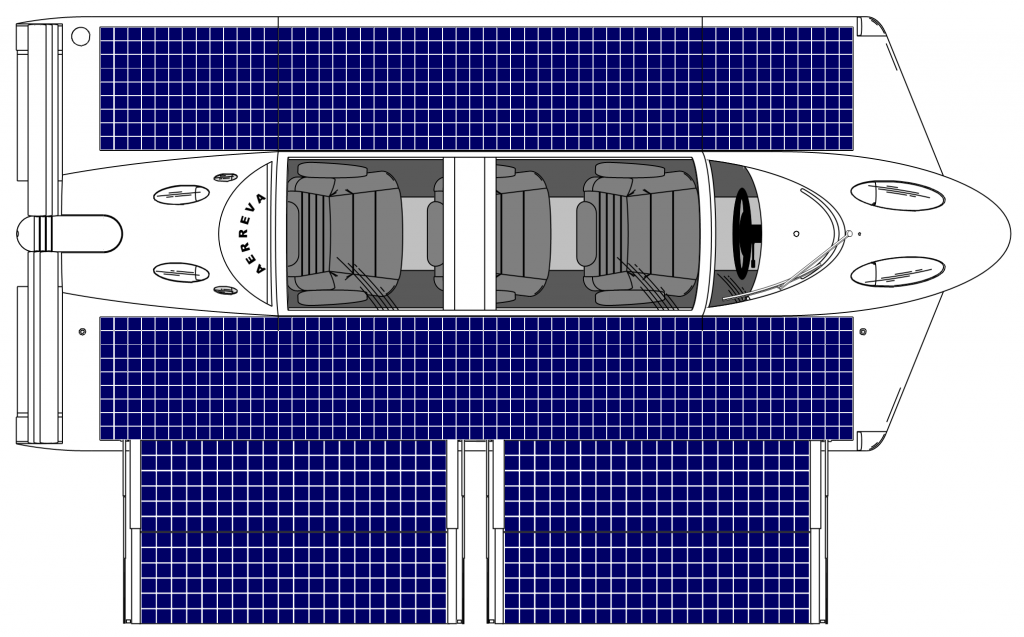
| Surface Mounted (Both Sides) |
(40 sf) 3.716 sq m | 5 kWh | 22% | 4.08 kWh | 122.63 kWh | 16.44 hrs | 904 mi |
| Extendable Hidden4 | (34 sf) 3.158 sq m | 5 kWh | 22% | 3.47 kWh | 104.23 kWh | 13.97 hrs | 768 mi |
| Combined | (74 sf) 6.874 sq m | 5 kWh | 22% | 7.56 kWh | 226.86 kWh | 30.42 hrs | 1,673 mi |
1. 5 kWh is the Annual Average Daily Solar Power Potential Per Square Meter for virtually the entire United States with all of the contiguous states falling between a 4-5 kWh and 5-6 kWh Annual Average. Source: The National Renewable Energy Laboratory, U.S. Department of Energy website https://www.nrel.gov/gis/solar.html.
2. Daily kWh solar energy production is obtained by multiplying the size of the solar panels by the Average Daily Solar Power Potential ( 5kWh) and by the solar panel efficiency (22%).
3. Driving Time and Range are based on 30 days of solar energy production and an estimated vehicle energy consumption of 7.457 kWh (10hp) at 55 mph (conservative estimate) and do not include the use of air conditioning or heating. Energy consumption at 55 mph is a conservative estimate.
4. Extendable Hidden Solar Panels’ energy production is shown with the panels in an extended and level position(0-degree tilt).
Notes:
Solar energy production values and range are estimated.
Tilting the solar panels into the sun can increase the daily kWh production. In low sun angle conditions a 1-Axis tracking system can increase solar energy production by around 50% while a 2-Axis tracking system (North-South and East-West Axis) will increase production by around 100%.
Solar energy production values are based on clean solar panels and favorable sun conditions on a clear day and do not take into account cloudy days or air pollution such as haze or smog which together can greatly reduce the efficiency of solar panels.
Loss due to solar energy conversion and charging is not included.
Measurements:
1. The maximum solar energy input rate is 1,000 watts (1 kW) for 1 square meter (perpendicular to the sun’s rays) at sea level on a clear day.
2. 1 square meter = 1.09361 square yard.
3. Solar panel size measured in square feet and square meters.